

Introduction
Cloud Watch is one of the powerful services of AWS that is used for Controlling the AWS services through Monitoring, Alerting, Reporting, and logging the AWS different services.
Cloud Watch displays the different matrices automatically about the services thus helping in monitoring the services. We can also create our own custom metrics that show the power of the cloud watch service.
Cloud Watch not only monitors the services but also helps in altering when the required condition is met, which helps in maintaining the services well and also helps in cost optimization. We can create an alarm that watches the metrics and sends the notification quickly in a desired medium like email, slack, etc.
Cloud Watch keeps the log details of the various services on its own.
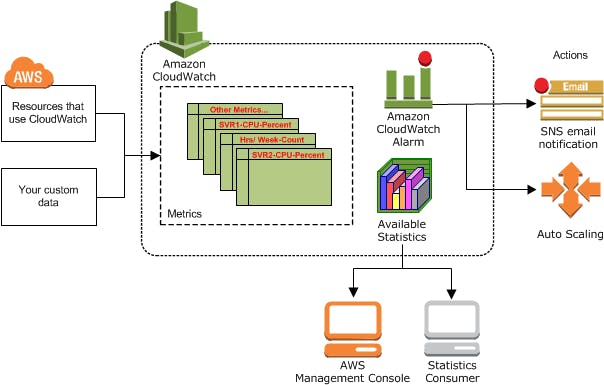
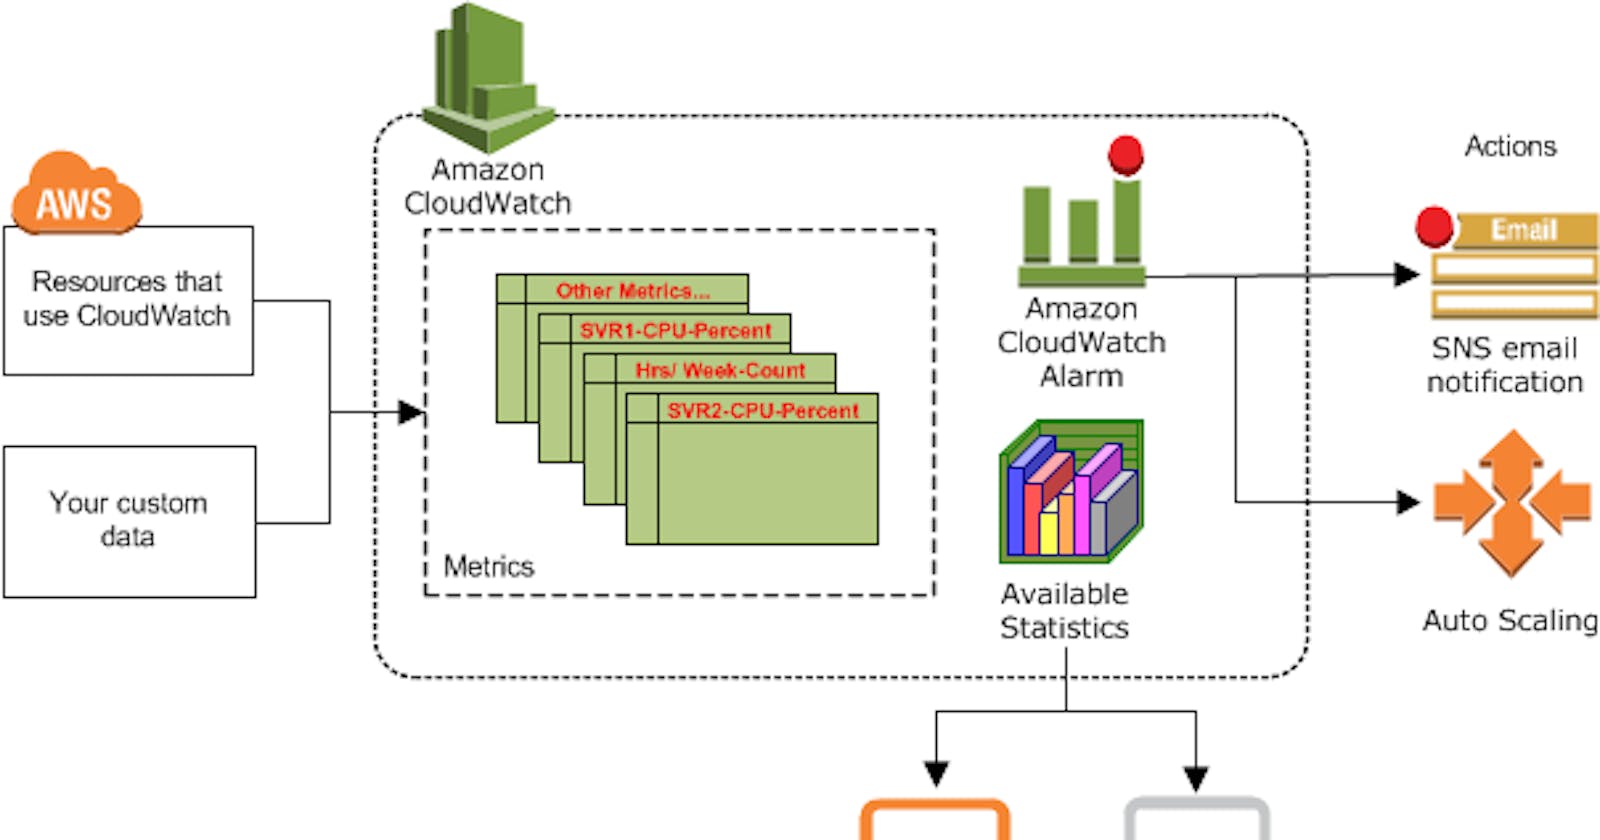
The above figure shows us how the cloud watch works. As we can see the cloud watch monitors the different metrics and displays the available statistics in aws management console in a different format. We also set the cloud watch alarm and the alarm will be activated when its requirement is met and send the alert to both SNS ( Simple Notification service ) Which can notify team members through various mediums like email.
We can Configure the alarm action to start, terminate, delay, or push notifications to SNS as well as an auto-scaling group.
DEMO:
Here in this demo we will create the ec2 instance and will run some Python script to vary CPU utilization we will monitor it using CloudWatch and also set the alarm to it sending to SNS when more than 50 percent of CPU is utilized.
Step 1: We create the ec2 instance and run the Python script to vary CPU utilization.

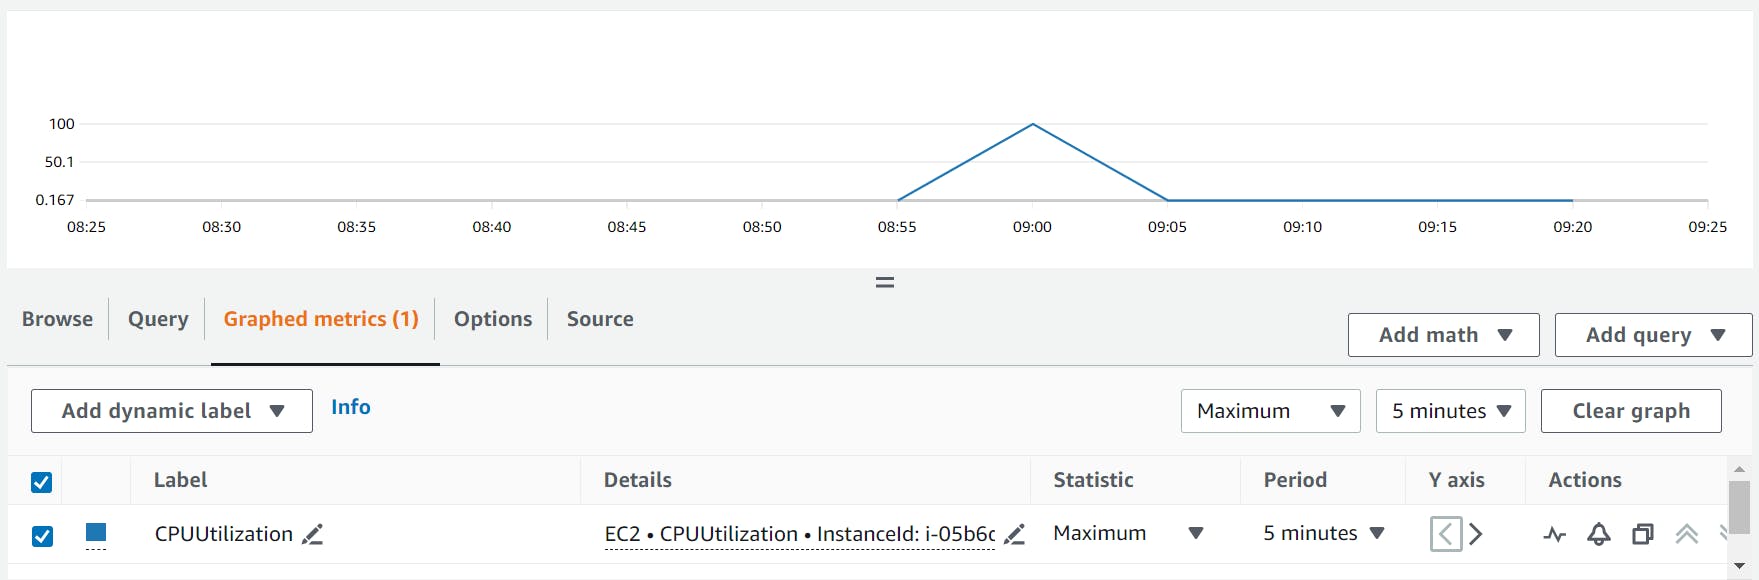
Step 2: We monitor the CPU utilization using the cloud watch and below the graph of the obtained value.
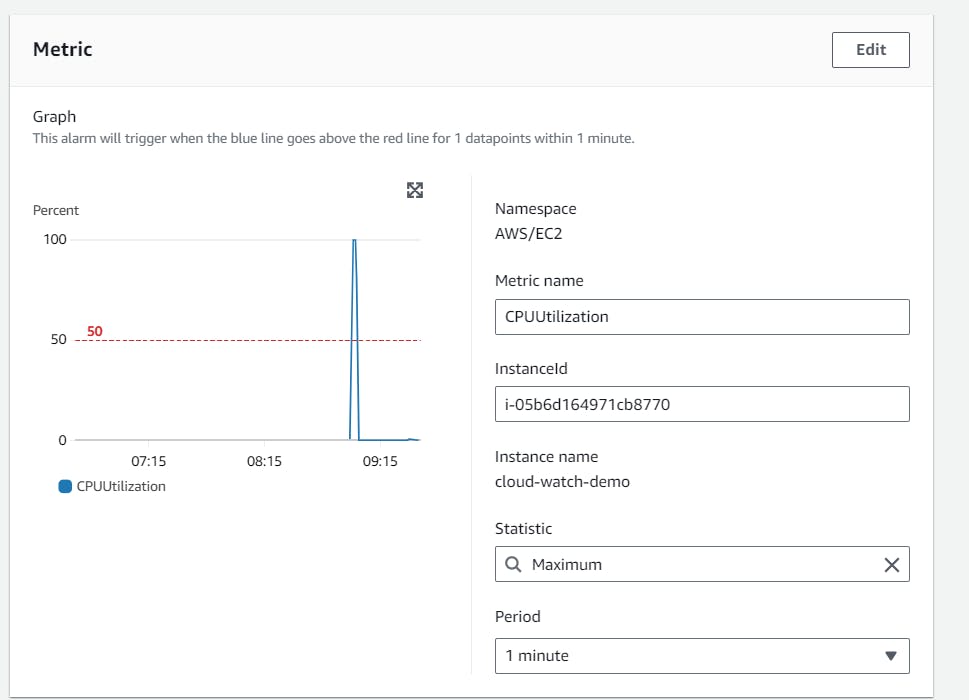
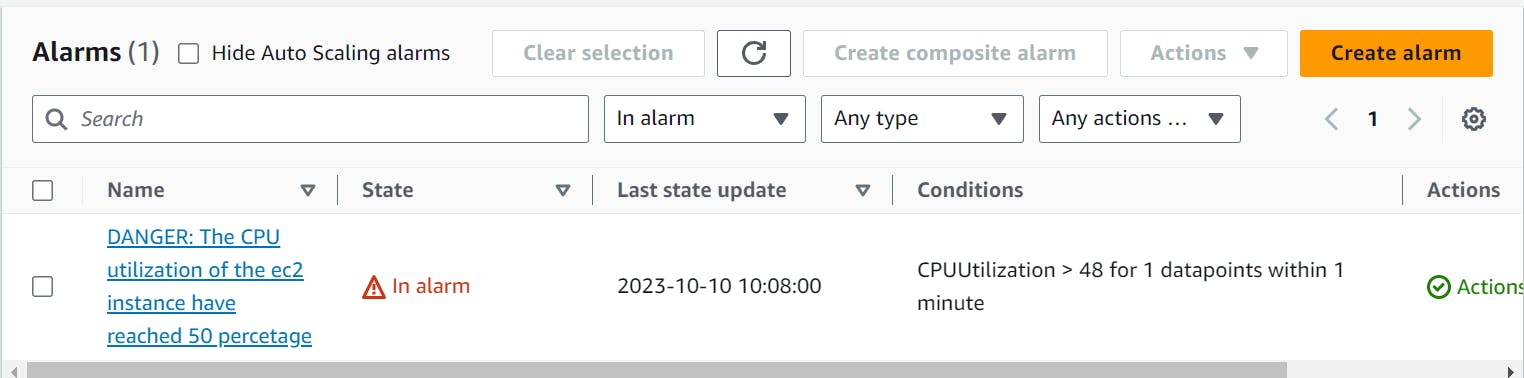
Step 3: We will set the Alarm so that when the CPU utilization increases to more than 50 percentage the Alarm will activate.
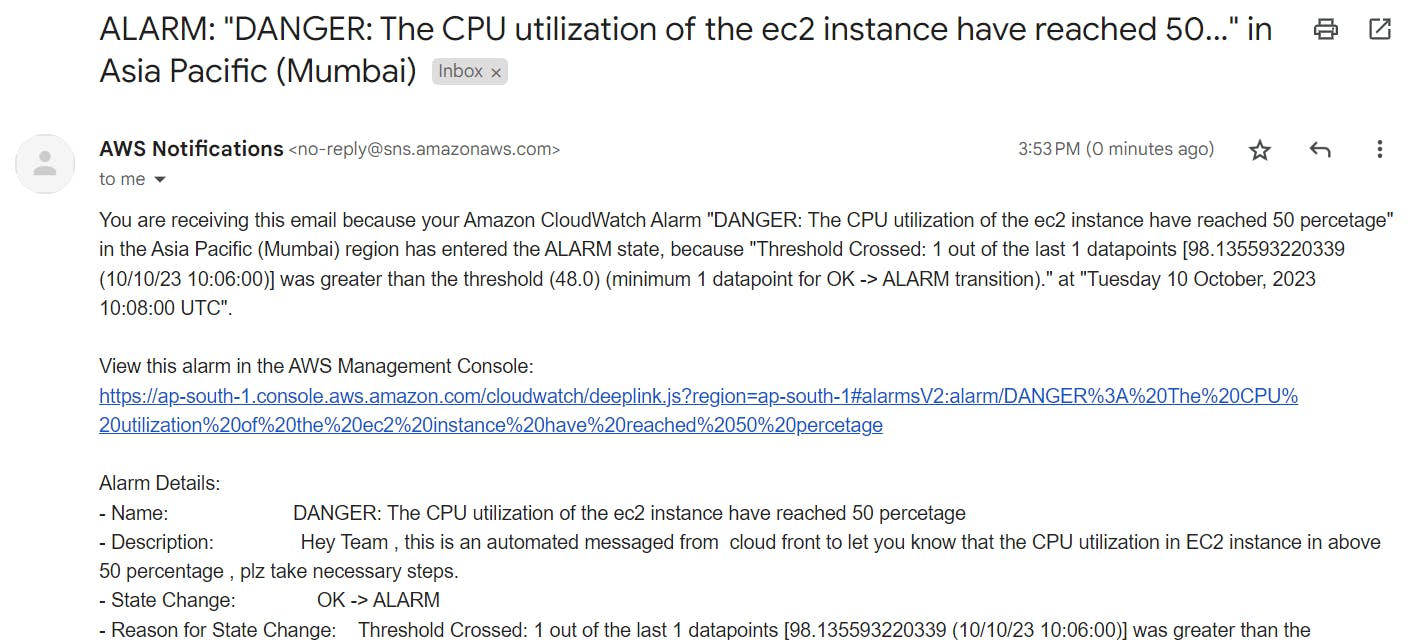
Step 4: When the CPU utilization reaches the required phaser the alarm is activated and the push email notification is sent as per the detail we fill while configuring the alarm.
Step 5: The push notification about the consumption of 50 percent of CPU in the ec2 instance is received and the concerned team will look forward to solving it.
Apart from the default metrics AWS Cloud Watch provides, we can also use our own custom matrices which make the Cloud Watch a more powerful service in motoring our AWS services.
Conclusion
This Article is the part of 30Day AWS series. This article only covers the fundamental knowledge about the cloud watch as I will keep on increasing the content in the coming days.
You can access the previous day's article here.